


Next: Systematic errors
Up: Fitting of histograms
Previous: Fit procedure
After running the fit, some QA needs to be done. There is a number of
options to explore here. The minimum is to verify that the fitted
kaon and proton peak position and asymmetry vs  make sense.
Figure 3:
Relative kaon and proton positions as a
function of total momentum for the different energies. The left
panel shows the relative positions as extracted from the fit and the
right panels show the results after subtracting the Bethe-Bloch
parameterisation. The error bars shown are statistical only. The lines
indicate the estimated limits for systematic error calculation.
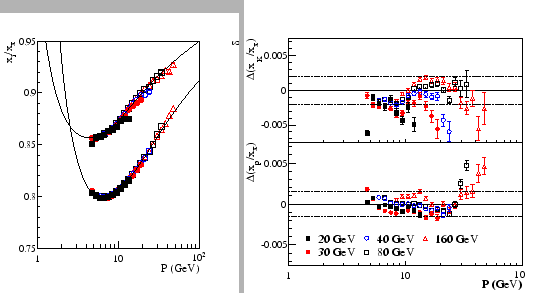 |
Fig. 3, left panel, shows the relative kaon and proton
position as extracted by the combined fit, as a function of total
momentum . The different marker styles and colors indicate results
for different beam energies. The line shows the parameterisation of the
Bethe-Bloch curve that is used to initialise the fit. The relative
positions of the electron and deuteron peak are fixed to this curve
as well. The right panel Fig. 3 shows the difference
between the fitted values and the parameterisations, for kaons and
protons separately (upper and lower right panels). The fits all agree
with the parameterisation at the level of 0.001-0.002 units in
relative position. At that same level, some systematic deviations are
seen between the different energies. The dashed curves show the
uncertainty band that is assigned for the systematic error calculation.
Figure 4:
Asymmetry parameter  as a
function of total momentum for the different energies.
as a
function of total momentum for the different energies.
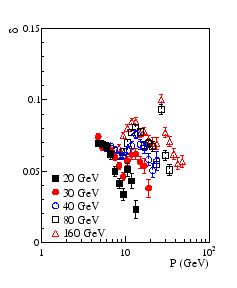 |
Fig. 4 shows the values of the asymmetry parameter
as extracted from the combined fit in each total momentum
bin. The different marker styles and colors indicate the different
energies. The asymmetry parameter has only a weak dependence on the
total momentum and beam energy. This is consistent with the idea that
the asymmetry arises from the intrinsic tail of the
Landau-distribution that governs energy loss.
In addition to those basic checks, it is a good idea to verify the
and  dependence of the fitted resolution parameter. The
-dependence should reflect the change in peak position, and also
shows some effect of the transition from standard resolution to high
resolution sectors in the TPC. The -dependence should be weak,
but a rather large spread of values in each
dependence of the fitted resolution parameter. The
-dependence should reflect the change in peak position, and also
shows some effect of the transition from standard resolution to high
resolution sectors in the TPC. The -dependence should be weak,
but a rather large spread of values in each  -bin may be
observed, mainly due to differences between tracks above the
-bin may be
observed, mainly due to differences between tracks above the  plane and below (two different
  -bins). Another cross-check is to
compare the extracted yields in the different -bins. I have
always observed a modest systematic difference between both bins, but
never followed up in detail. There might be a difference in
acceptance/efficiency between those bins as well.
-bins). Another cross-check is to
compare the extracted yields in the different -bins. I have
always observed a modest systematic difference between both bins, but
never followed up in detail. There might be a difference in
acceptance/efficiency between those bins as well.
Next: Systematic errors
Up: Fitting of histograms
Previous: Fit procedure
Marco van Leeuwen
2009-01-14