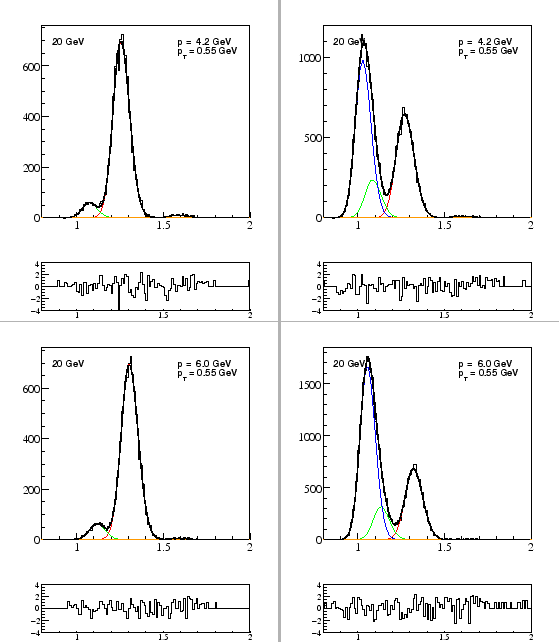
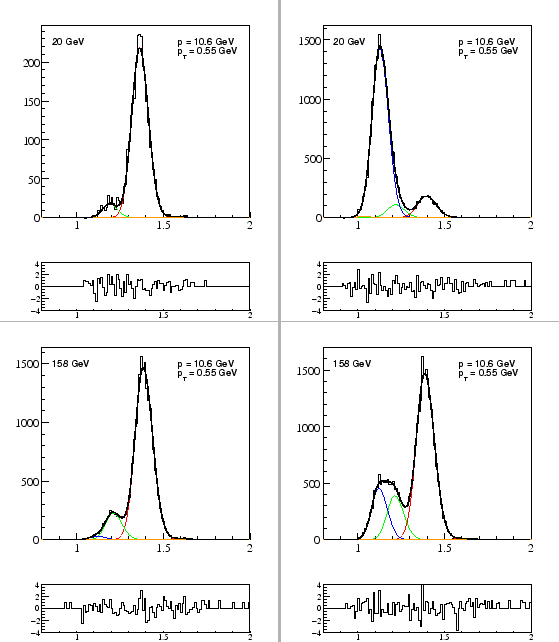
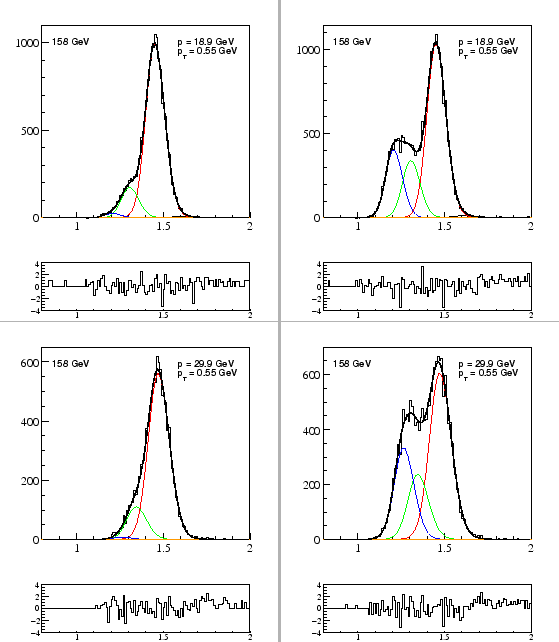
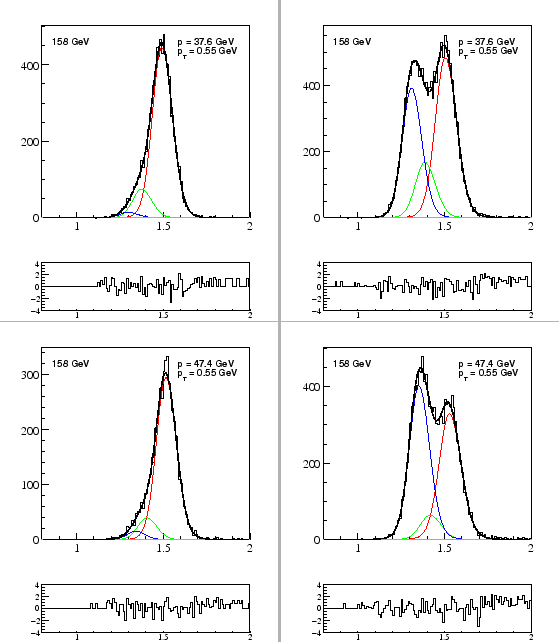
On the following pages are example ![]() distributions at total
momentum 4,6,10,19, 30, 38 and 47 GeV. The lower bins are taken from
the 20
distributions at total
momentum 4,6,10,19, 30, 38 and 47 GeV. The lower bins are taken from
the 20
![]() data, while the higher bins are from 158
data, while the higher bins are from 158
![]() data. There are plots at 10 GeV for both energies for comparison. The
highest and lowest bins are at (or even slightly beyond) the limits of
the momentum range for the kaon analysis. All plots are for positive
particles and
data. There are plots at 10 GeV for both energies for comparison. The
highest and lowest bins are at (or even slightly beyond) the limits of
the momentum range for the kaon analysis. All plots are for positive
particles and
![]() GeV/
GeV/![]() . The top panels show measured
distribution and fit and the lower panel are the fit residuals,
divided by the statistical error (so the values are 'number of sigma'
deviation).
. The top panels show measured
distribution and fit and the lower panel are the fit residuals,
divided by the statistical error (so the values are 'number of sigma'
deviation).